Published by Shri Ajay Maken, Member of Parliament, Rajya Sabha. Independent analysis of official CPCB monitoring data. Data compiled by CREA, with our thanks for its work in creating awareness. CREA has no involvement in this site. Contact: [email protected]

Report · 27 October 2026

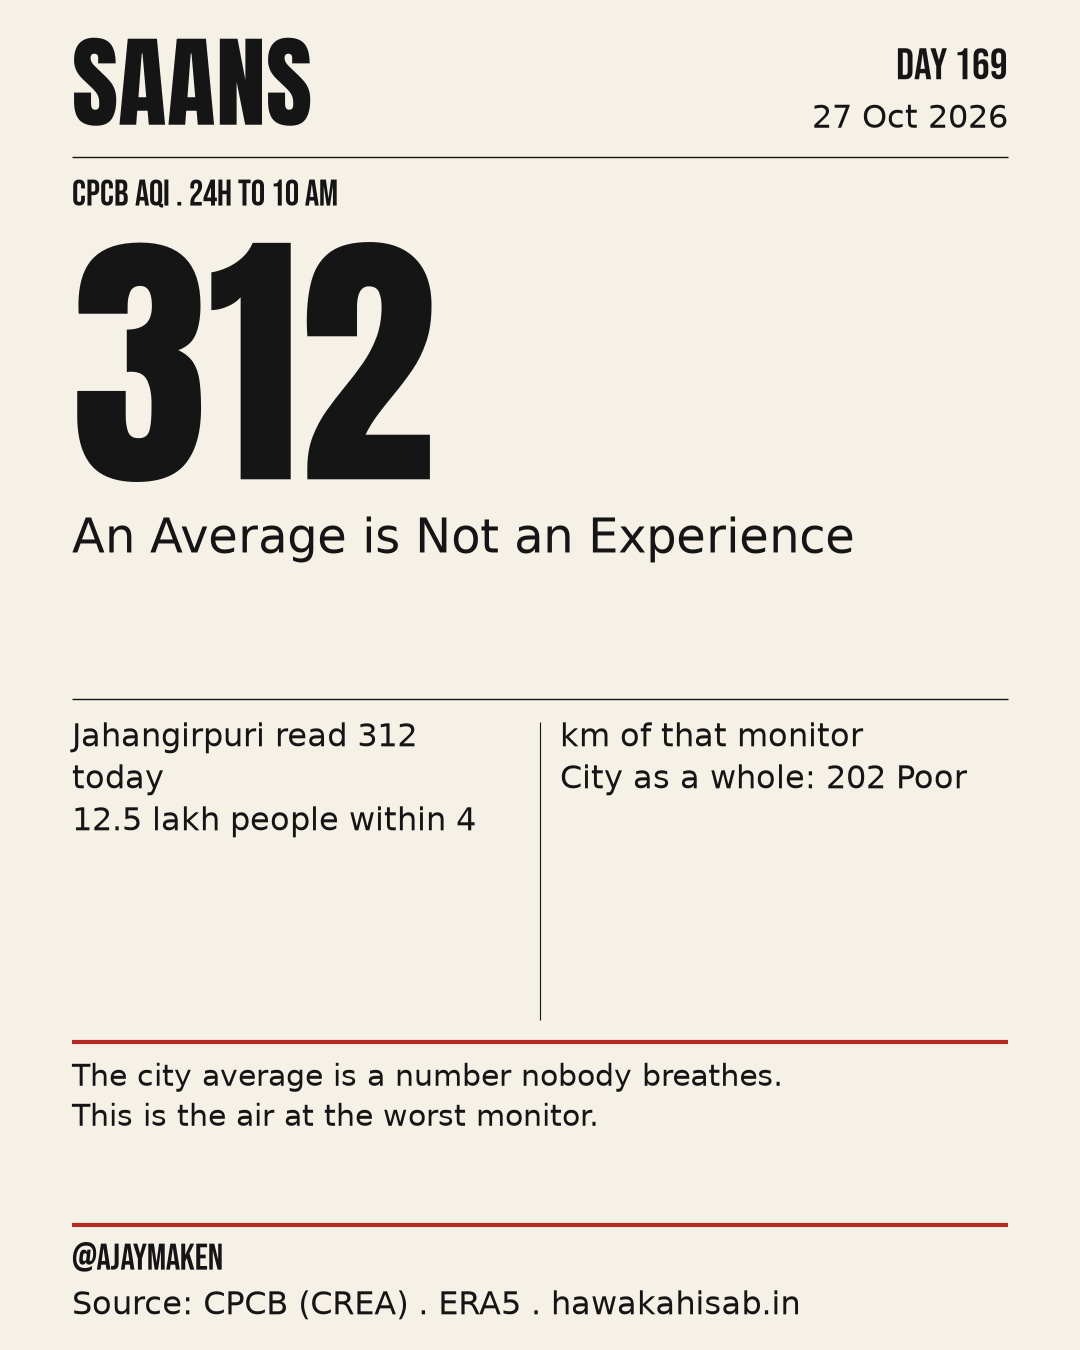
312 AQI at Jahangirpuri, 24 hours to 4 PM, 27 October 2026, the worst monitor in Delhi today, Very Poor on CPCB's documented formula, and PM2.5 set that figure. 12.5 lakh people live within 4 km of it.

202.2
TODAY
Delhi's AQI calculated with CPCB's documented formula, the mean of 56 stations.
1.74 crore
NEAR POOR OR WORSE
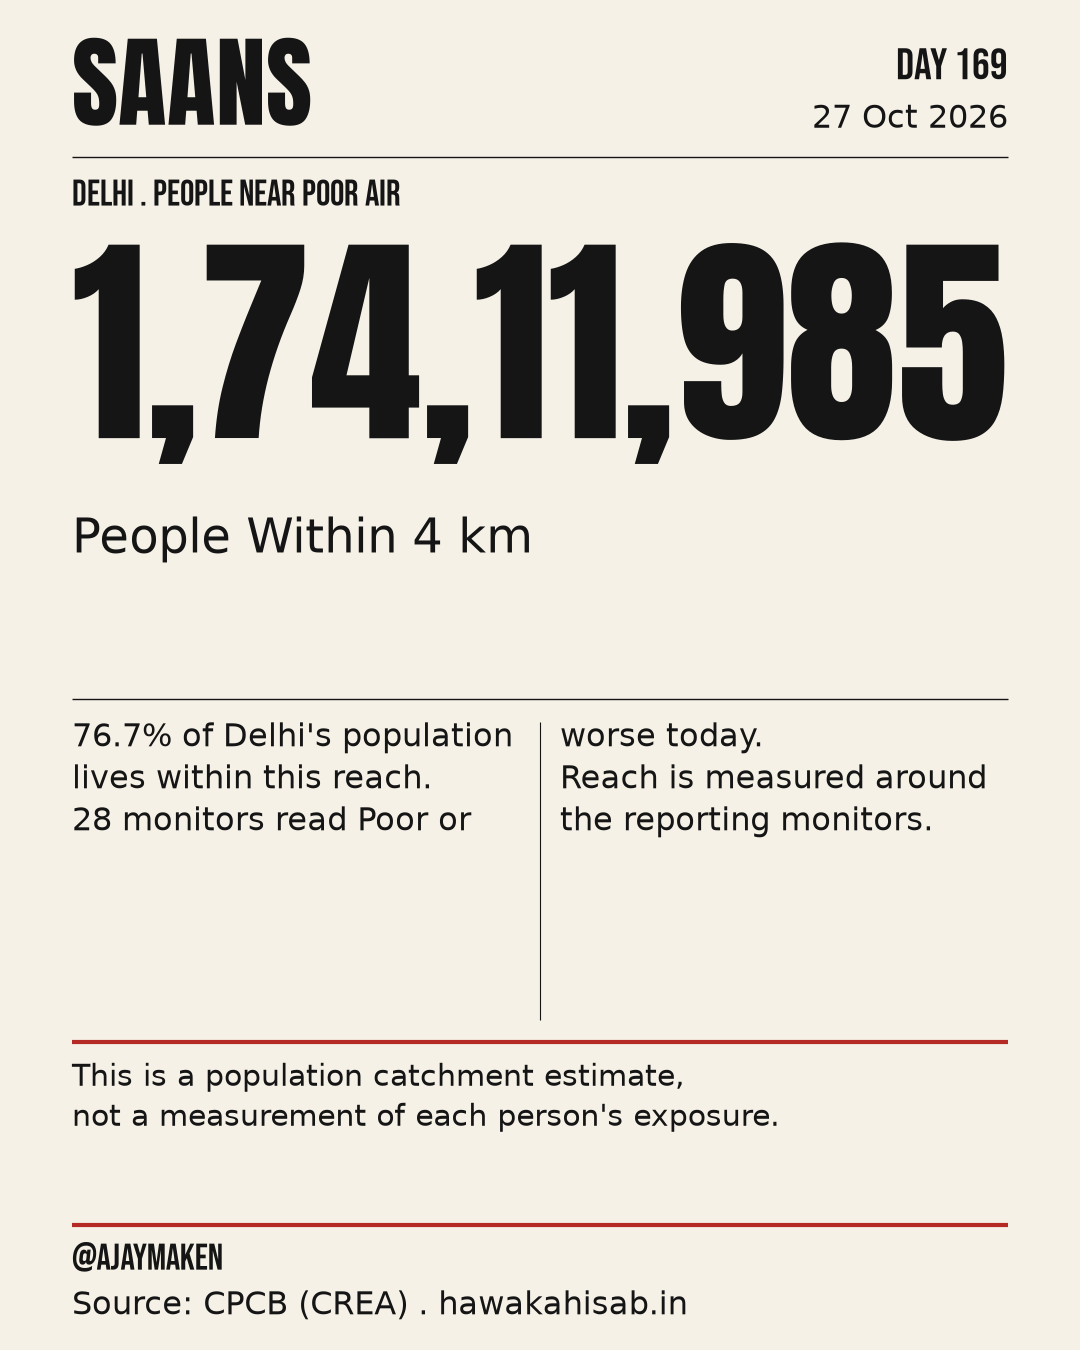
Within 4 km of 28 Poor-or-worse monitors: 76.7 per cent of Delhi, every pollutant counted.
6.0x
THE WHO 24-HOUR LINE
Delhi's PM2.5 today, as measured, against the WHO 24-hour guideline.

Today in cards

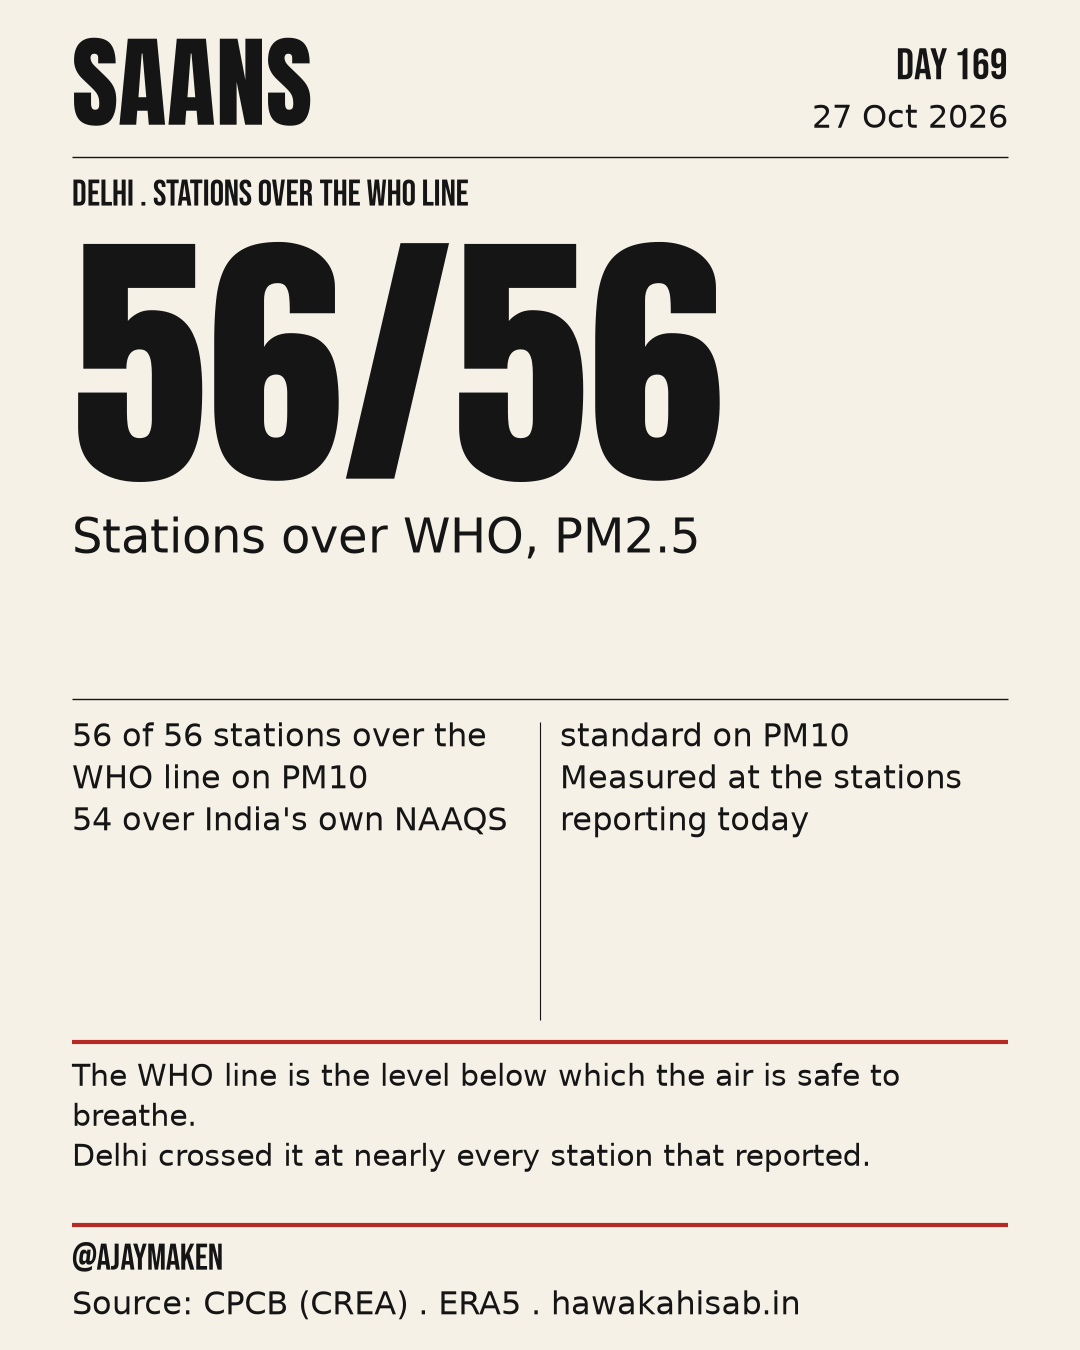
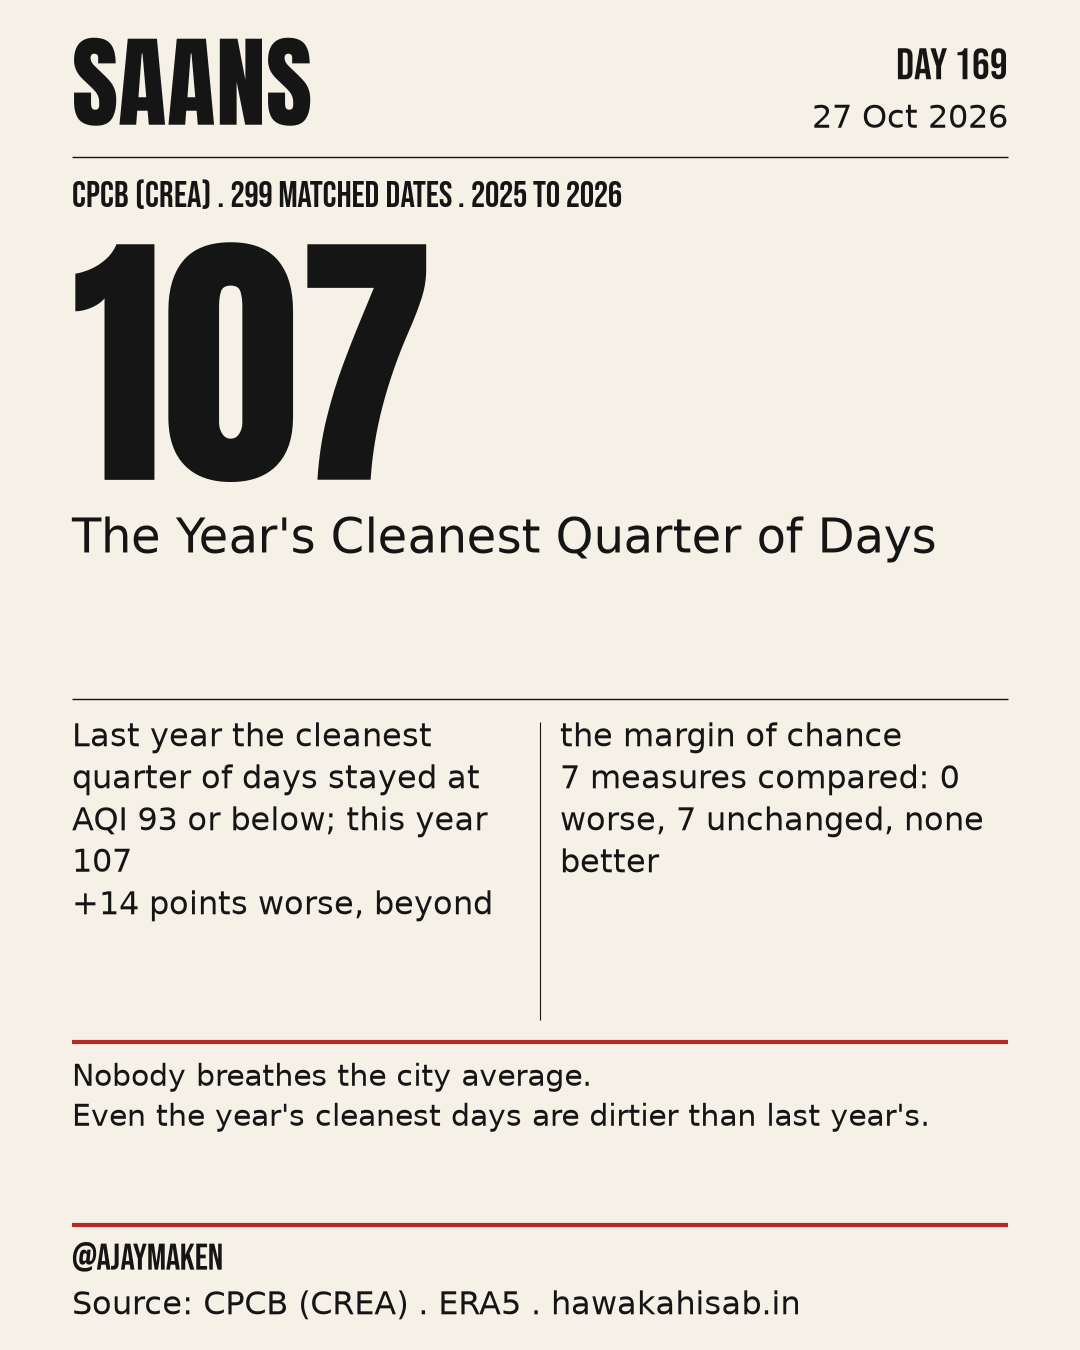
17,411,985 people (76.7%) live within 4 km of a station that read PoorJahangirpuri AQI 312; 1253432 people within 4 km56/56 stations over WHO on PM2.5, 56/56 on PM10The year's distribution on matched dates

Cards approved for hawakahisab.in. Tap one to open it full size.

The AQI figures here are calculated with the formula that the Central Pollution Control Board (CPCB) publishes for its air quality index. CPCB's own documents set out that formula: CPCB's note on how the AQI is calculated; CPCB's AQI calculator.

The full report

The complete written report for this day, with every figure and the source it comes from.

Download the daily reportPDF, 4.7 MB
Narrated in Hindi. Runs 52 seconds.

The day in brief

Today, 27 October 2026, 24 hours to 4 PM: Delhi's AQI was 202.2, Poor, calculated with CPCB's documented formula as the mean of 56 stations' AQIs (CPCB's note "How is AQI calculated?" and its AQI Calculator; page 34 sets out the formula). As measured, 44 of the 44 monitors reading PM2.5 were above the WHO 24-hour guideline of 15 µg/m³. Above AQI 200 today: 28 stations, Jahangirpuri 312, Rohini 308, Mundka 306, R K Puram 303, and 24 more in the station table. Poor or worse air reached 1.74 crore people within 4 km of their monitor today, 76.7 per cent of Delhi.

The year so far, 1 January to 26 October: the cleaner days of 2026 have been the dirtiest for these dates since 2019, because three days in four read above 107.3 on the particle AQI, against 93.0 on the same dates of 2025. The middle day reads 154.0 against 141.5 on the same dates last year. On an average day, 27.0 per cent of Delhi's reporting monitors, about 12 of 44, sat above 200 on the particle AQI.

The findings

What the report says

Against yesterday: the one-day move
From 174 to 202. On the 55 stations that reported on both days, the 95 per cent interval runs 22.7 to 34.3 points.
Against last year: the observed reading
Today 202 across 56 stations. The year is judged on the 37 matched stations: 224 today against 333, the mean of the same date ±7 days of 2025 at those stations. The interval runs -127.5 to -90.7 points.
The worst station in the city today
Very Poor, set by PM2.5. Its PM2.5 averaged 136.1 µg/m³ over the 24 hours to 4 PM, 9.0 times the WHO 24-hour guideline of 15 µg/m³. Last year this station read 378 on the mean of the same date ±7 days, so the change is -66 points. 12.5 lakh people live within 4 km of this monitor. Within 500 m of the monitor, 92% of the land is built up and 7% is under vegetation, so this reading describes a densely built neighbourhood.
The year, from its best days to its worst
On the same 299 complete dates, 1 January to 26 October, the best tenth of days reads 76.8 against 72.3 and the worst tenth 283.3 against 308.8. The days at or below 200 went from 211 to 216.
How much of the city was above AQI 200
That is 11.5 of 44.0 reporting stations, against 27.9 per cent over the same dates last year, a change of -0.9 points on an interval of -7.3 to +5.1, so it is unchanged inside its margin.
Who the monitoring network reaches
Within 4 km live 92 per cent of Delhi's people, within 2 km 44 per cent, and within 500 m only 3.5 per cent. The map holds 55 monitors in 53 zones; 56 monitors reported today. 33 of the 53 zones stretch past our chosen 4 km proximity threshold, informed by US EPA neighbourhood-scale guidance.
What each monitor's reading speaks for
That is 76.7 per cent of Delhi, living around the 28 monitors that read Poor or worse. Jahangirpuri was worst at 312, and 12.5 lakh people live within 4 km of it. This counts people near the monitors, not measured individual exposure.