प्रकाशक श्री अजय माकन, Member of Parliament, Rajya Sabha. सीपीसीबी के सरकारी आँकड़ों का स्वतंत्र विश्लेषण। आँकड़ों का संकलन CREA द्वारा। जागरूकता के उसके प्रयासों के लिए हमारा आभार। इस साइट में CREA की कोई भागीदारी नहीं है। संपर्क: [email protected]

रिपोर्ट · 27 October 2026

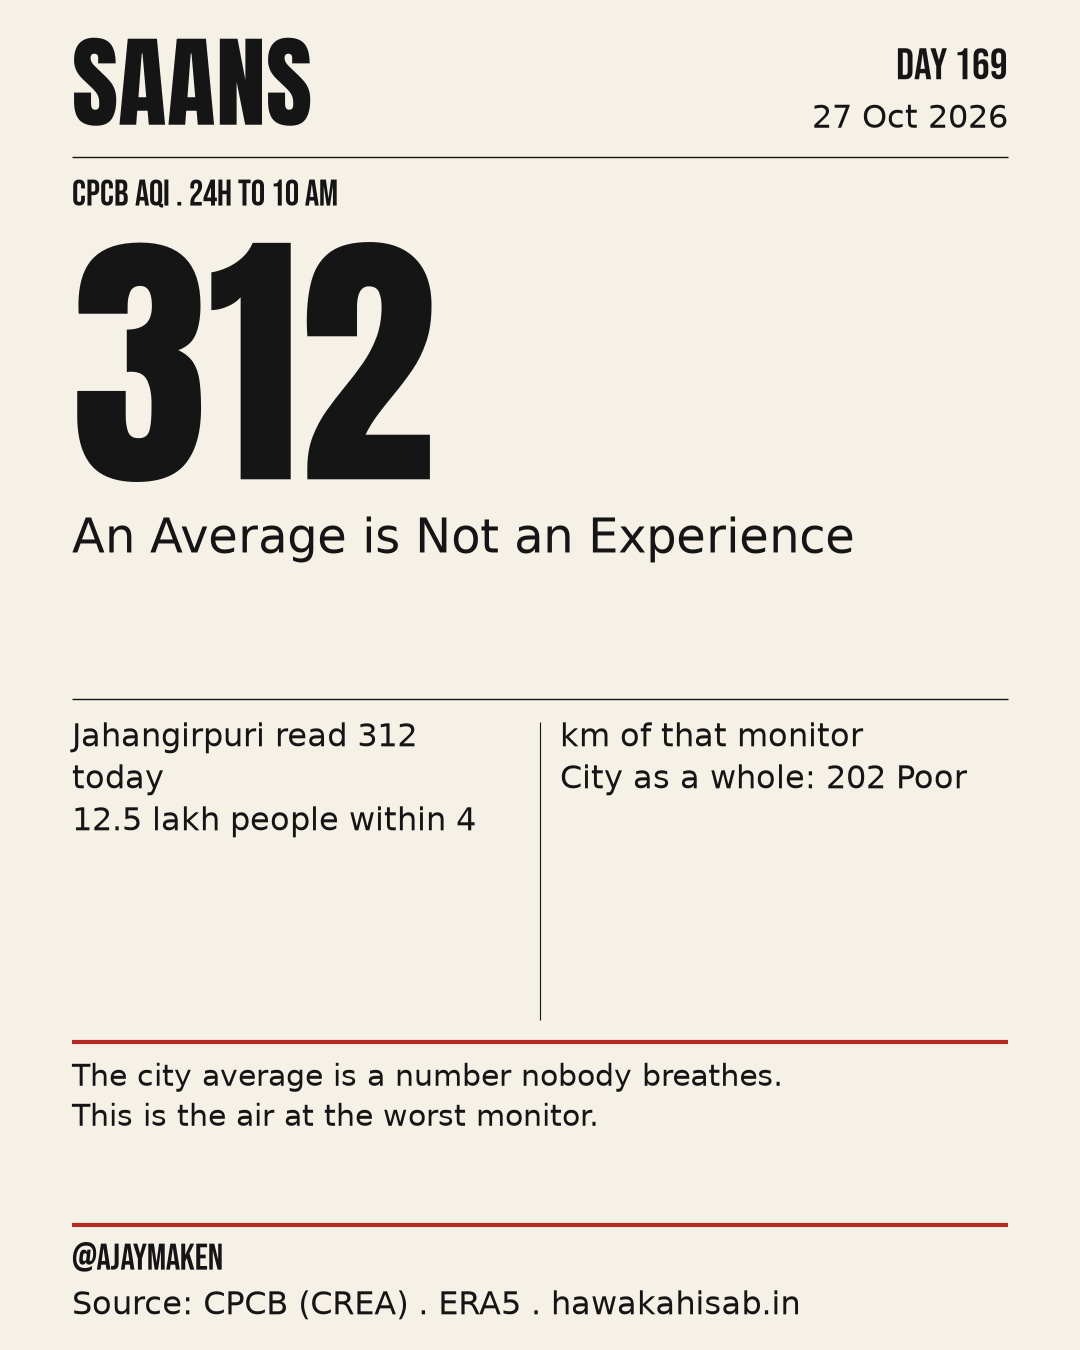
312 AQI at Jahangirpuri, 24 hours to 4 PM, 27 October 2026, the worst monitor in Delhi today, Very Poor on CPCB's documented formula, and PM2.5 set that figure. 12.5 lakh people live within 4 km of it.

202.2
TODAY
Delhi's AQI calculated with CPCB's documented formula, the mean of 56 stations.
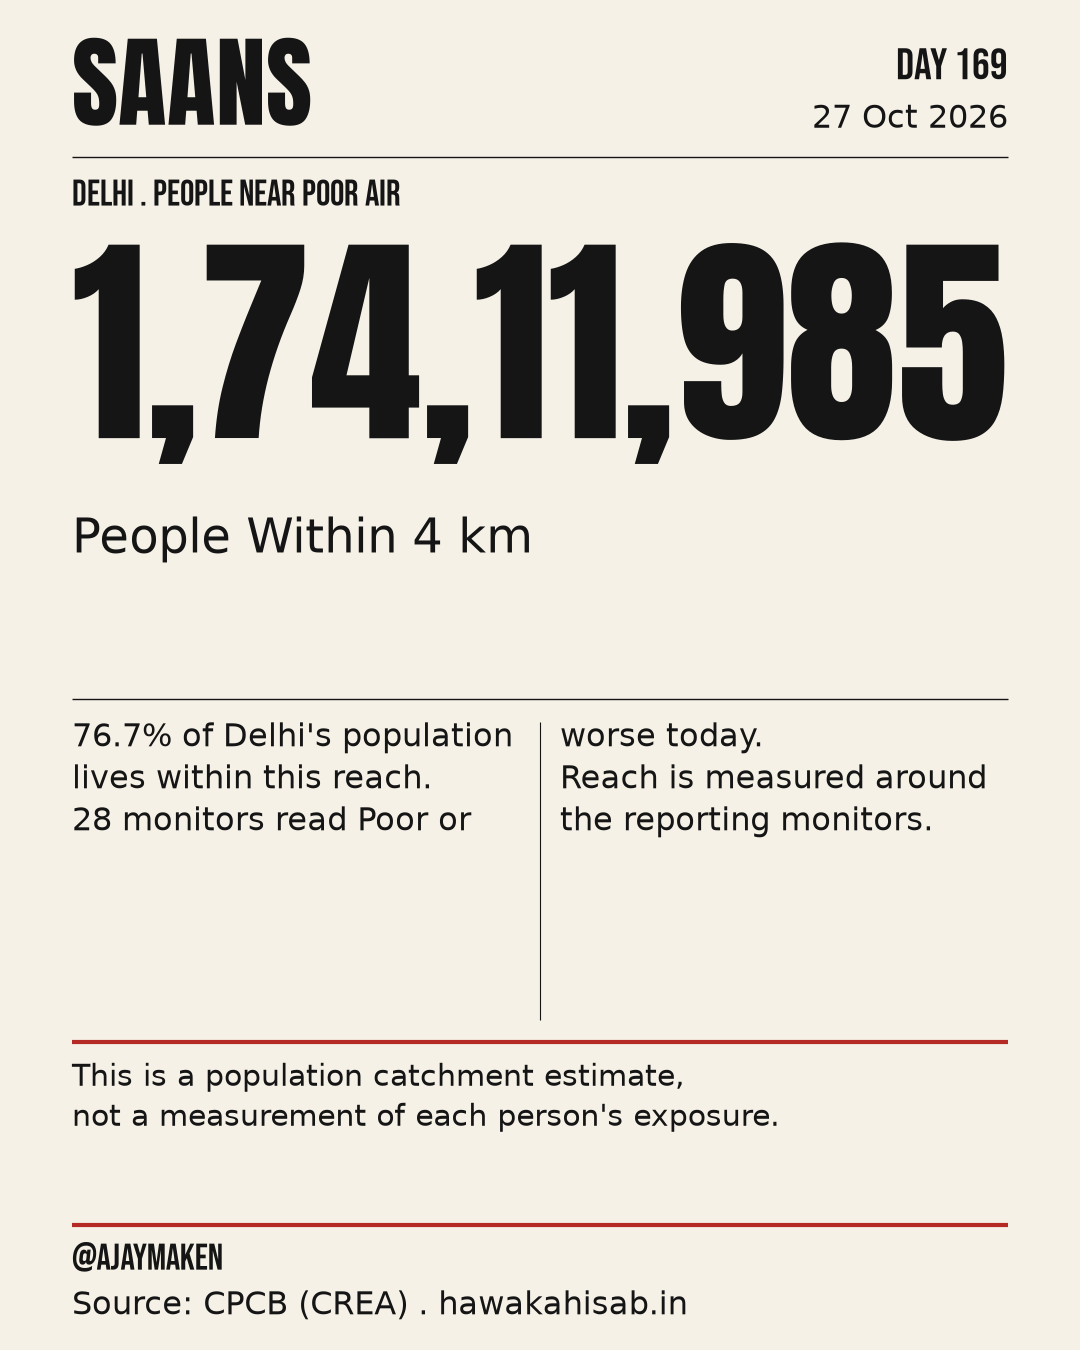
1.74 crore
NEAR POOR OR WORSE
Within 4 km of 28 Poor-or-worse monitors: 76.7 per cent of Delhi, every pollutant counted.
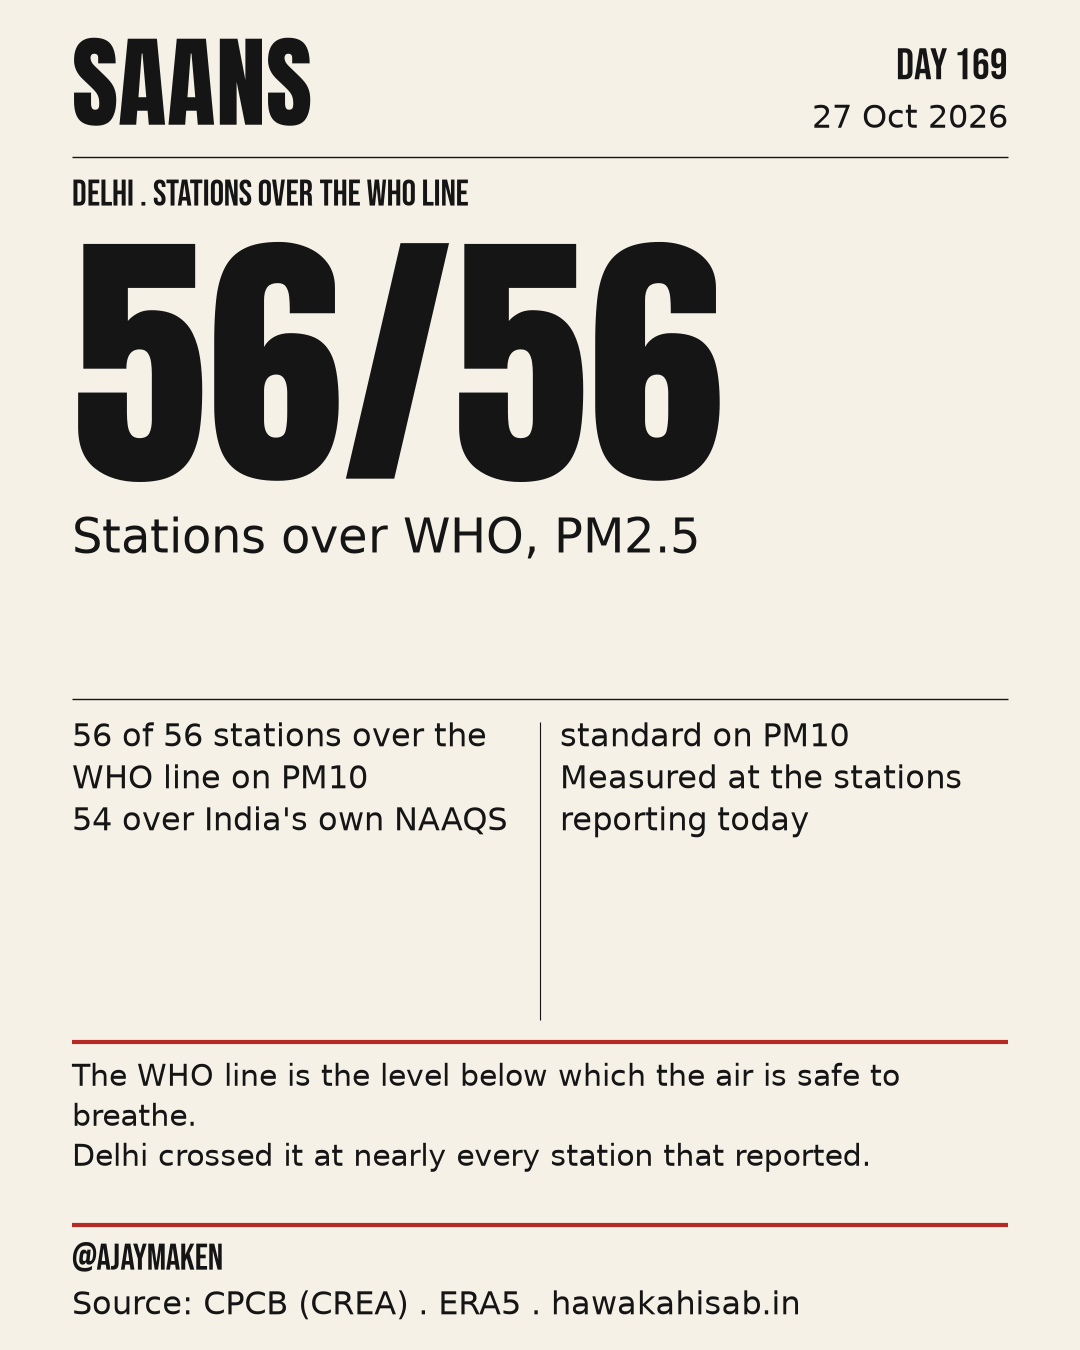
6.0x
THE WHO 24-HOUR LINE
Delhi's PM2.5 today, as measured, against the WHO 24-hour guideline.

आज के कार्ड

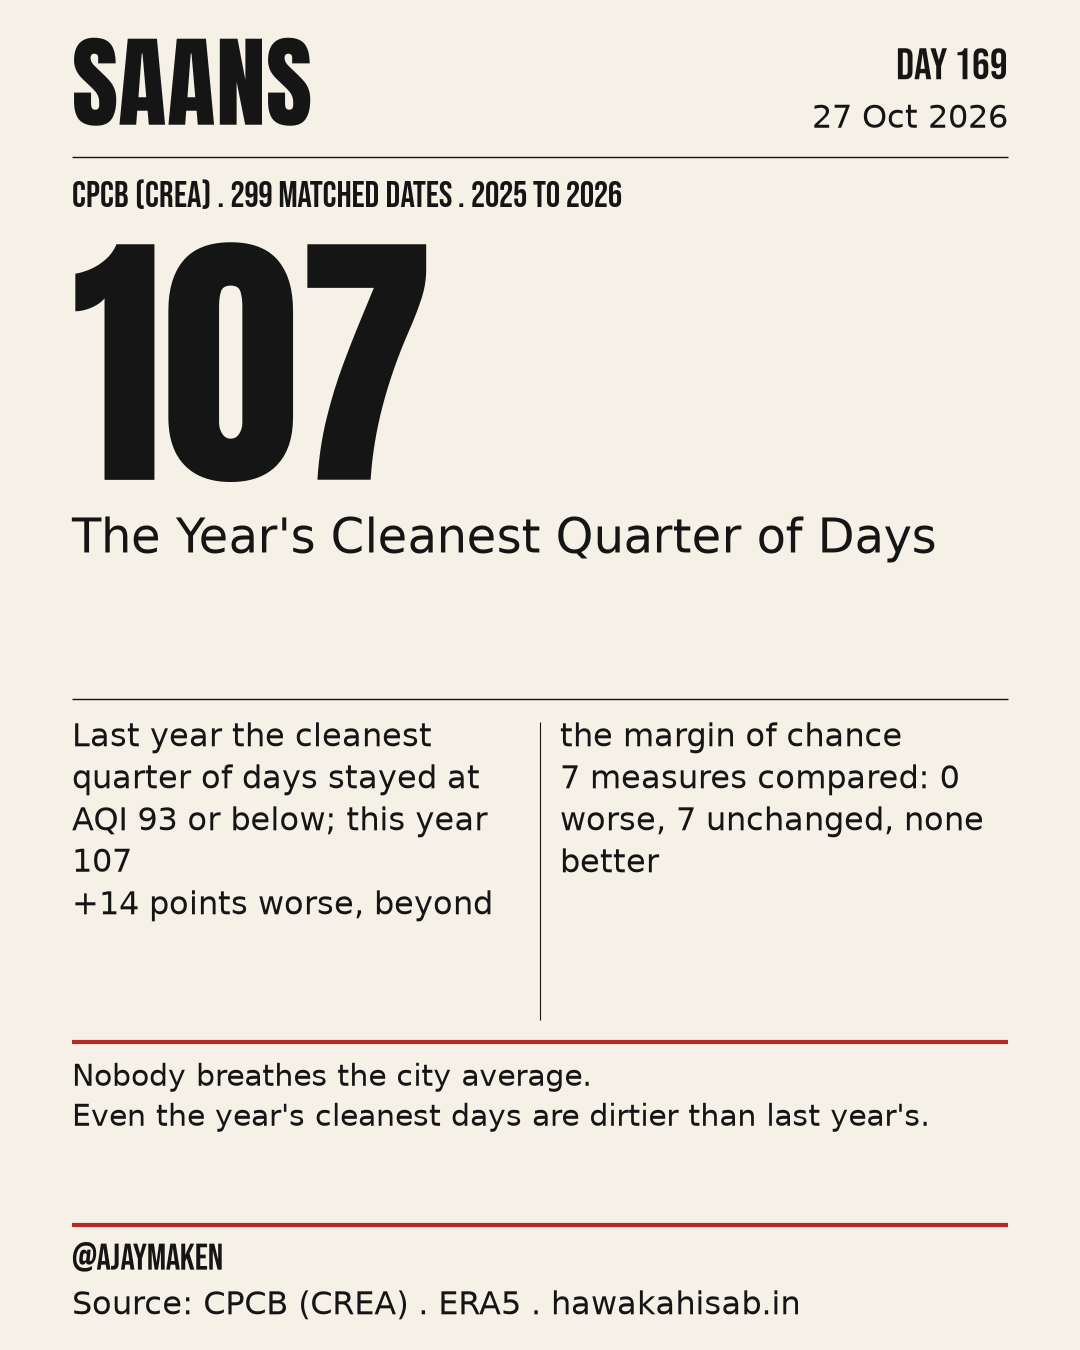
17,411,985 people (76.7%) live within 4 km of a station that read PoorAQI में सबसे ऊँचा — Jahangirpuri AQI 312; 4 किमी में 12 लाख 53 हज़ार लोगWHO सीमा पार — PM2.5 56/56, PM10 56/56 (NAAQS 54)Year to date on 299 matched dates: lower quartile 93 to 107 (unchanged

hawakahisab.in के लिए स्वीकृत कार्ड। पूरा देखने के लिए किसी एक पर टैप कीजिए।

यहाँ के एक्यूआई आँकड़े उसी फ़ॉर्मूले से निकाले गए हैं, जो केंद्रीय प्रदूषण नियंत्रण बोर्ड (CPCB) अपने वायु गुणवत्ता सूचकांक के लिए प्रकाशित करता है। यह फ़ॉर्मूला CPCB ने अपने दस्तावेज़ों में दिया है: CPCB का नोट: एक्यूआई कैसे निकाला जाता है; CPCB का एक्यूआई कैलकुलेटर।
यह रिपोर्ट अंग्रेज़ी में है।

पूरी रिपोर्ट

इस दिन की पूरी लिखित रिपोर्ट, हर आँकड़े और उसके स्रोत के साथ।

रोज़ की रिपोर्ट डाउनलोड करेंPDF, 4.7 MB
हिंदी में। अवधि 52 सेकंड।

दिन का सार

Today, 27 October 2026, 24 hours to 4 PM: Delhi's AQI was 202.2, Poor, calculated with CPCB's documented formula as the mean of 56 stations' AQIs (CPCB's note "How is AQI calculated?" and its AQI Calculator; page 34 sets out the formula). As measured, 44 of the 44 monitors reading PM2.5 were above the WHO 24-hour guideline of 15 µg/m³. Above AQI 200 today: 28 stations, Jahangirpuri 312, Rohini 308, Mundka 306, R K Puram 303, and 24 more in the station table. Poor or worse air reached 1.74 crore people within 4 km of their monitor today, 76.7 per cent of Delhi.

The year so far, 1 January to 26 October: the cleaner days of 2026 have been the dirtiest for these dates since 2019, because three days in four read above 107.3 on the particle AQI, against 93.0 on the same dates of 2025. The middle day reads 154.0 against 141.5 on the same dates last year. On an average day, 27.0 per cent of Delhi's reporting monitors, about 12 of 44, sat above 200 on the particle AQI.

निष्कर्ष

रिपोर्ट क्या कहती है

यह रिपोर्ट अंग्रेज़ी में है।

Against yesterday: the one-day move
From 174 to 202. On the 55 stations that reported on both days, the 95 per cent interval runs 22.7 to 34.3 points.
Against last year: the observed reading
Today 202 across 56 stations. The year is judged on the 37 matched stations: 224 today against 333, the mean of the same date ±7 days of 2025 at those stations. The interval runs -127.5 to -90.7 points.
The worst station in the city today
Very Poor, set by PM2.5. Its PM2.5 averaged 136.1 µg/m³ over the 24 hours to 4 PM, 9.0 times the WHO 24-hour guideline of 15 µg/m³. Last year this station read 378 on the mean of the same date ±7 days, so the change is -66 points. 12.5 lakh people live within 4 km of this monitor. Within 500 m of the monitor, 92% of the land is built up and 7% is under vegetation, so this reading describes a densely built neighbourhood.
The year, from its best days to its worst
On the same 299 complete dates, 1 January to 26 October, the best tenth of days reads 76.8 against 72.3 and the worst tenth 283.3 against 308.8. The days at or below 200 went from 211 to 216.
How much of the city was above AQI 200
That is 11.5 of 44.0 reporting stations, against 27.9 per cent over the same dates last year, a change of -0.9 points on an interval of -7.3 to +5.1, so it is unchanged inside its margin.
Who the monitoring network reaches
Within 4 km live 92 per cent of Delhi's people, within 2 km 44 per cent, and within 500 m only 3.5 per cent. The map holds 55 monitors in 53 zones; 56 monitors reported today. 33 of the 53 zones stretch past our chosen 4 km proximity threshold, informed by US EPA neighbourhood-scale guidance.
What each monitor's reading speaks for
That is 76.7 per cent of Delhi, living around the 28 monitors that read Poor or worse. Jahangirpuri was worst at 312, and 12.5 lakh people live within 4 km of it. This counts people near the monitors, not measured individual exposure.